
Hospitals and integrated delivery networks (IDNs) moving to value-based reimbursement can’t hit quality and equity targets by tracking a few population health metrics. They need longitudinal insight into high-risk groups. Yet, it’s tough to link clinical, operational, and demographic data using the fragmented system. The stakes are high: 90% of the $5.3 trillion the U.S. spent on healthcare in 2024 went toward chronic and mental-health conditions, many of them predictable and avoidable.
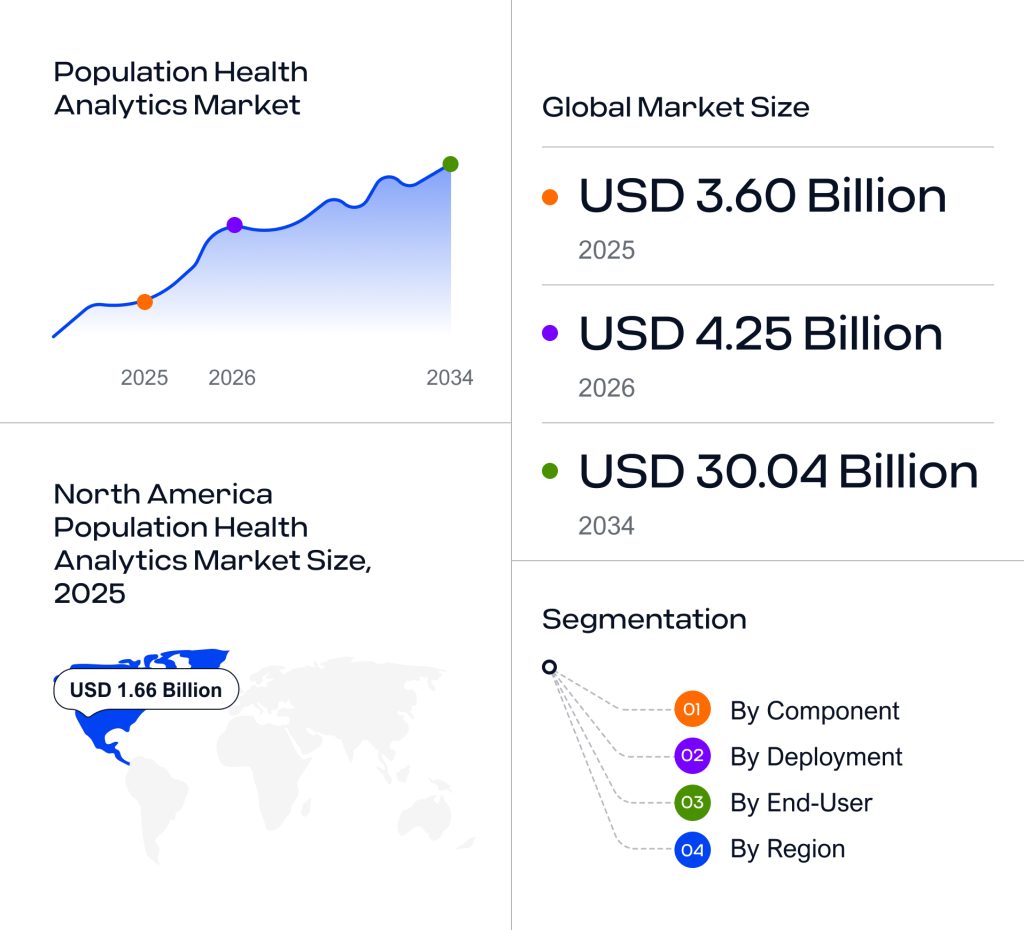
Building population health analytics helps with this task by combining electronic health records (EHRs), claims data, lab results, and social determinants of health to flag risk earlier and surface care gaps before crises occur. The numbers show how fast this capability is becoming a necessity: $3.60 billion in 2025, expected to reach $30.04 billion by 2034.
In this article, we’ll explain what population health data analytics is and compare the main implementation strategies. We’ll also outline how Edenlab supports this work through data enablement and architecture design services, and where products like Kodjin Analytics can strengthen the overall stack.

Highlights:
- In one heart failure program, claims-based population analytics helped cut emergency department visits by 40%.
- The population health analytics market is expected to grow from $3.60B in 2025 to $30.04 by 2034, reflecting how quickly value-based care is raising expectations.
- With more than 276 million healthcare records exposed or impermissibly disclosed in 2024, strong governance is now a baseline requirement.
What Is Population Health Analytics, and Why Is It Valuable?
Population health analytics examines how patient groups change over time, what influences outcomes, and which interventions have a discernible impact. According to the U.S. Centers for Disease Control and Prevention (CDC), population health is a strategy that identifies significant health issues and helps organizations allocate resources to address the causes of poor health.
Leading organizations use population analytics to:
- Identify high-risk groups and care gaps. When population health data from across the system is brought together, it becomes easier to flag patients heading toward complications or hospitalization.
- Plan resources and improve patient care quality. Hospitals can use clinical and demographic data together to better allocate resources, reach the right patients, and plan proactive interventions. Analytics-driven programs cut down on hospital readmissions by 17% in 30 days and 28% in 90 days. One claims-based heart-failure program reduced emergency department (ED) visits by 40%.
- Support equity and public‑health reporting. Population analytics highlight disparities across race, socioeconomic status, and geography, enabling targeted interventions and more equitable care. They also provide longitudinal records required for public‑health reporting and research.
- Move from descriptive to predictive and prescriptive insights. Modern tools apply machine‑learning models to predict sepsis, readmission risk, or chronic disease progression and deliver recommendations in real time.
Population health analysis gives health systems a firmer grasp of value-based care. It helps teams see who is at risk, understand why, act early, and confirm whether those actions improved outcomes across facilities and patient groups. Read more about advanced analytics in healthcare in our recent article.
Key Challenges in Implementing Population Health Analytics
Population health analytics tends to break in predictable ways, especially in multi-hospital systems operating under value-based reimbursement. The challenges are not abstract. They show up in measure disputes, missed care gaps, inconsistent risk scores, and delayed reporting.
The table below summarizes the most common analytics challenges and how they directly affect value-based performance.
| Population health analytics challenge | How it shows up in value-based reimbursement work |
| Fragmented and inconsistent data | Measures do not reconcile across sites, attribution gets messy, and risk scores vary depending on the source system. |
| Longitudinal complexity | You cannot reliably demonstrate timing-based outcomes, such as post-discharge follow-up, care-gap closure windows, or pre- and post-intervention impact. |
| Analytics-ready data model choices | The same measure logic is implemented differently across teams and tools, leading to disputes over performance and contract reporting. |
| Governance and privacy | Access becomes slower and riskier, audits become painful, and teams avoid using sensitive data even when it is needed for contract performance. |
| Workflow adoption | Insights stay in dashboards, not in daily work, so care gaps remain open, and outreach does not happen at scale. |
| Scalability across sites | Refresh cycles lag, cohorts go stale, and value-based reporting arrives too late to change outcomes during the performance period. |
These issues rarely exist in isolation. In practice, one weakness reinforces another. Fragmented data makes longitudinal analysis harder. Weak governance undermines trust in measures. Poor workflow integration reduces the impact of even well-built analytics.
Below, we look at each challenge in more detail and explain why solving it requires more than just adding another dashboard.
Fragmented and inconsistent data
Most health systems draw data from multiple sources, including electronic health record (EHR) systems, labs, billing feeds, and public health databases, and each one uses its own naming and coding conventions. As a result, the same lab test might appear as “HbA1c,” “A1c,” or a local code that only makes sense inside one facility. When those differences are not reconciled, risk scores start to wobble, and teams stop trusting the results.
Complexity of longitudinal and nested data
True population analytics depends on understanding time: sequences of events, gaps in care, dependencies between actions, and how outcomes change after an intervention. Healthcare data is inherently longitudinal and highly structured: patient journeys span multiple encounters, measurements, medications, and clinical decisions, all linked over time and context. This data is typically stored in hierarchical or relational forms with nested attributes and cross-references.
Selecting the right data model
For many health systems, FHIR becomes the most practical foundation for population health because it preserves clinical meaning and supports interoperability across sites. The difficulty is that FHIR was designed for data exchange, not large-scale analytics, so it needs additional structuring to support reliable cohort building, quality measures, and risk models.
Kodjin Analytics addresses this by keeping FHIR as a native standard while organizing the data into analytics-ready structures. This allows teams to maintain consistent definitions across facilities and run longitudinal analysis without rewriting logic for every dashboard or measure.
Governance and privacy constraints (contract risk)
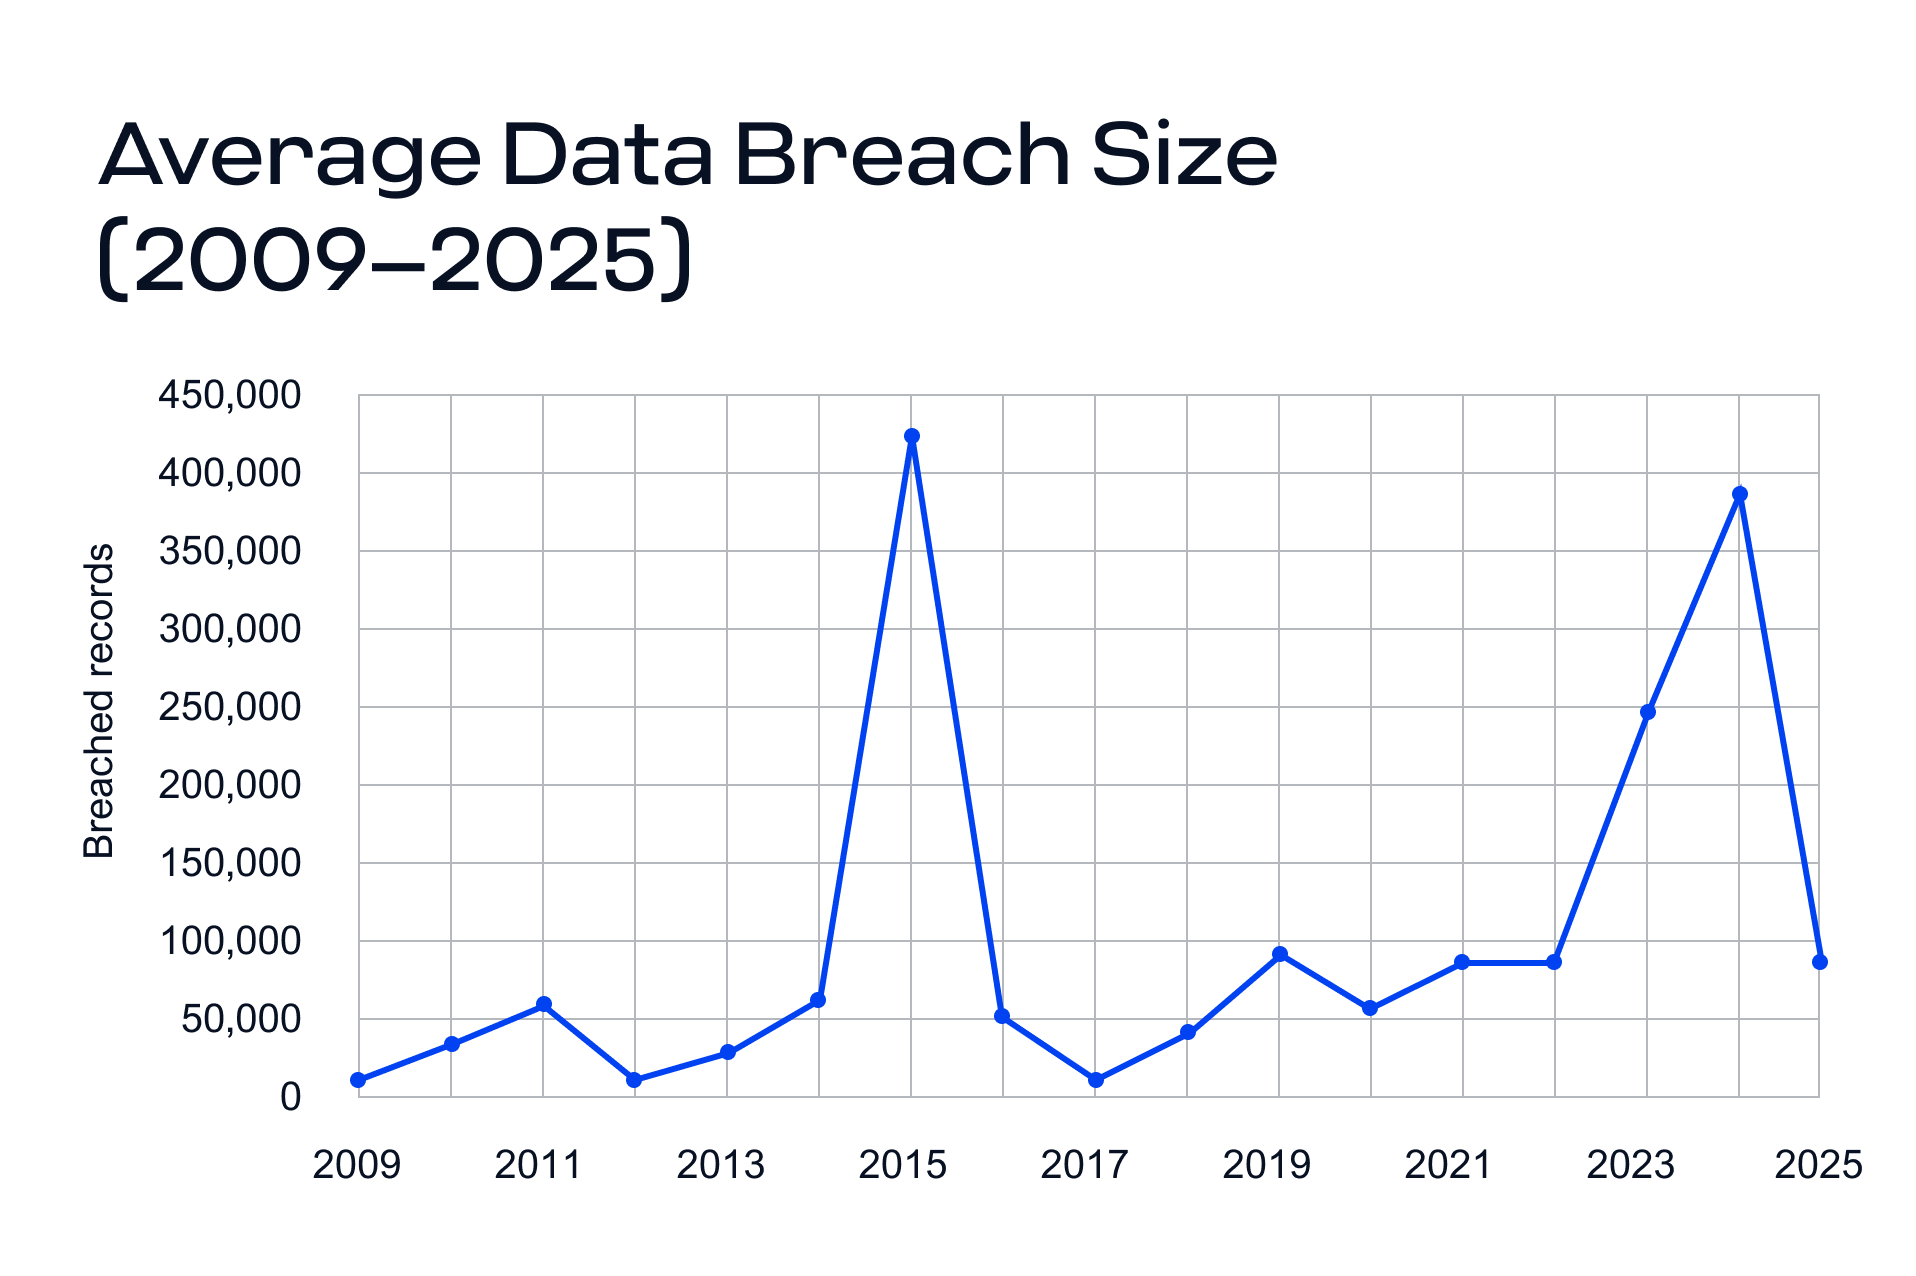
Privacy and security rules affect how population health data can be used and shared across teams and facilities. The risk is real: in 2024 alone, more than 276 million healthcare records were exposed or impermissibly disclosed in breaches reported to the Office for Civil Rights (OCR). HIPAA governs the use and disclosure of protected health information and includes formal de-identification pathways, while GDPR and CCPA add requirements around lawful use, minimization, and individual rights.
Clinician adoption and workflow integration
In many organizations, population health turns into a patchwork of tools. There is one place for registries, another for quality dashboards, another for reporting, and another for care management. On a busy day, that sprawl creates friction. Over time, the programs that work converge on a single source of truth with role-based access, so clinicians, care managers, population health data analysts, and leaders rely on the same definitions and data in views that fit their roles.
Scalability and performance
Population health workloads are heavy: large cohorts, long time horizons, and frequent refresh cycles. When nested clinical data is involved, performance problems surface quickly, especially if the architecture forces many joins and lookups across the event history. Teams often rely on columnar storage and query patterns to keep cohort builds and quality measures usable.
Gaining multi-facility insights
Multi-hospital population analytics gets harder as soon as you move beyond a single facility. You need infrastructure that can support regional programs, clinically meaningful longitudinal records, and governed access for sensitive use cases such as artificial intelligence, research, and public health reporting.
At scale, the platform choices matter less than the architecture decisions:
- Can you bulk move and refresh data predictably?
- Can you support both operational use and secondary use without rebuilding pipelines twice?
- Do you have privacy controls that allow compliant sharing, de-identification, and auditability?
Edenlab helps hospital systems solve all these challenges by designing semantically aligned, temporally precise data architectures that make cohorts, measures, and model inputs reliable across facilities. Learn more about our healthcare data analytics services.
Need help turning healthcare data into usable insight?
We can support you. Explore our
Healthcare data analytics servicesFor instance, recently we worked with an analytics vendor to build an advanced platform that processes health data using graph- and AI-based analytics. The platform is designed to surface data quality and consistency issues and generate actionable health insights. Its users plan to apply it across primary care, specialty care, and research services, including research tied to stem cells and alternative medical procedures.
Data ingestion starts with providers and payers, and the platform must meet US regulatory requirements while also building reusable compliance capabilities that can support expansion into other regions over time.
Edenlab supported this effort by shaping the data and governance foundation the platform needs to work at scale. We focused on interoperability-first ingestion, semantic standardization, and built-in privacy controls, so our clients could trust its signals and reuse definitions across use cases, teams, and future territories. Read more of our healthcare analytics case studies.
Strategies for Effective Population Health Analytics Implementation
There is no “best” approach to population health analytics. Most health systems combine tools and data patterns over time. The key is to pick a strategy that aligns with your maturity, timeline, and workflow realities. Longitudinal analysis and strong data governance remain mandatory in every scenario.
1) Vendor-led platforms vs custom warehouse + business analytics tools
Vendor-led, ready-made platforms are useful when you need to move quickly with a model that already works. They help set up registries, monitor quality, identify risk, and manage care gaps without building everything from the ground up. This path fits teams that lack data engineering capacity or want predictable rollout support.
This approach becomes a poor fit when the platform turns into another portal nobody uses. It can also disappoint when you need deep customization, cross-vendor flexibility, or strict control over data logic. Vendor platforms sometimes act like a black box: you get results, but it’s hard to see how cohorts, measures, or risk scores were built.
A custom enterprise warehouse with specific population health analytics tools gives you more control: you can align logic across hospitals, adapt cohorts to your real workflows, and serve different teams from a single, consistent source. It also fits organizations that already run strong data engineering and analytics programs.
2) Proprietary data model vs interoperability-first
A proprietary model can move fast for a narrow set of use cases. It can also support performance tuning for specific dashboards and measures. The trade-off is portability. Integrations and cross-organization sharing often become harder later.
An interoperability-first model makes reuse easier across systems and partners. FHIR often works well as a canonical model for clinical interoperability. In turn, OMOP is good for research-style cohort analysis. Many teams use a hybrid: FHIR for ingestion and exchange, and an analytics-friendly layer for scale.
Kodjin Analytics helps turn standards-based data into consistent, reusable analytics concepts without forcing every team to query raw FHIR structures directly.
3) Descriptive analytics vs predictive analytics
Descriptive analytics answers “what happened” and “where are we off track.” It supports quality reporting, utilization insight, care gaps, and program monitoring. It also builds trust because stakeholders can validate the numbers.
Predictive analytics answers “what might happen next” and “who needs attention now.” It supports risk stratification, early intervention, and capacity planning. This path works when teams explain the model logic, monitor drift, and keep feature definitions stable across facilities.
Want to dive deeper into how large-scale datasets drive better decisions? Read our recent article on big data analytics in the healthcare industry.
4) Near real-time vs scheduled refresh
Near real-time analytics helps when timing drives outcomes. Think emergency department follow-up, missed appointments, rising risk signals, and care management queues. It also reduces the “too late to act” problem.
Scheduled refreshes support population health reporting and trend analysis. It fits quality measures, contract performance, and program evaluation. Most teams start with regular data refreshes, then add real-time feeds where faster action makes a difference. But no matter the timing, people need to trust what they see. That means every data point should come with clear definitions, reliable timestamps, and traceable sources, or else teams will stop relying on it.
Most organizations start where they are, prove value, then evolve the stack. Edenlab helps by analyzing your value-based goals, care programs, and data constraints across facilities, then proposing the most realistic path forward.
Solutions to Implement Population Health Analytics
A strong population health program doesn’t rely on a single tool. It’s typically a full stack that includes a consistent data foundation, dependable integration to keep information flowing, and analytics and workflow tools that teams can use effectively. Below are the most common solution types and how they align with different strategies.
Data integration, transformation, and quality across sources
Population health analytics relies on a steady flow of reliable data. Even with a strong model in place, you need to gather information from EHRs, billing systems, public health sources, and others, while keeping everything aligned as systems and formats change.
Integration work usually covers patient matching across facilities, terminology mapping, de-duplication with correct event ordering, and support for both scheduled loads and event-driven updates.
If you want tighter control over the analytics pipeline, an ELT layer like Kodjin can handle ingestion and transformations into the analytics store, while the engine focuses on connectivity and interfaces.
Analytical platforms for cohort and outcome analysis
This is the part that most people think of first, and it’s also the area where “solution mix” matters most. Different products play different roles depending on whether you’re vendor-led, warehouse-led, or hybrid. A few common categories:
| Platform category | Best fit strategy | What it typically does | Common examples |
| EHR-native population health modules | Vendor-led (especially single-EHR environments) | Keeps adoption high by working inside day-to-day clinical workflows; supports registries, care gaps, worklists, and contract-performance views | Epic population health tooling |
| Source-agnostic population health platforms | Vendor-led or hybrid (multi-facility, mixed EHRs) | Ingests data from multiple EHR systems plus claims and other feeds; normalizes data to build a longitudinal view for cohorts, quality, and risk operations | Oracle Health population health/data platforms |
| Enterprise data platform + business intelligence (BI) + care-management tooling | Custom warehouse-led or hybrid | Uses an enterprise data warehouse (or lakehouse) as the “source of truth,” then layers BI dashboards for reporting and care-management tools for action (worklists, outreach, closed-loop tracking) | Health Catalyst (data platform category); Microsoft Power BI; Tableau; care-management applications |
| FHIR-compatible analytics platforms | Interoperability-first or hybrid | Makes cohort building, event-based reporting, equity cuts, and predictive features practical on top of standards-based data; keeps longitudinal timelines queryable and reusable | Kodjin Analytics lets teams define cohorts and measures once and reuse them across dashboards, reports, and models, eliminating the need to rebuild the same logic every time. |
Need a standards-based foundation? See how we handle medical analytics software development at scale.
Conclusion
Population analytics can stabilize performance across facilities and surface risk earlier, but dashboards alone won’t get you there. The difference is a solid data foundation that preserves longitudinal timelines, maintains consistent definitions across sites, and supports governance you can trust.
Once that foundation is in place, the rest becomes a practical set of choices: buy, build, or go hybrid; start with descriptive reporting and expand into predictive work; add near-real-time signals where they change outcomes. Edenlab helps teams design that foundation and choose the right approach. And when a standards-based analytics layer makes sense, Kodjin Analytics can help teams work with interoperable data without having to rebuild logic for every cohort, dashboard, or model.

Make population analytics work in practice
Value-based care needs more than dashboards. Edenlab builds the data model and architecture that keeps cohorts, measures, and workflows consistent across sites.
FAQs
What is the future of population health?
The future is more proactive and more operational. Population health is moving beyond retrospective reporting toward earlier risk detection, tighter care-gap workflows, and equity monitoring that leaders can act on. Expect more interoperability-driven data sharing, more near-real-time signals for care management, and more focus on model transparency so clinicians and quality teams trust what they see.
Can analytics be implemented without disrupting daily operations?
Yes, if it’s rolled out in phases and tied to existing workflows. Most teams start with a small set of high-impact use cases (e.g., readmissions, emergency department utilization, diabetes, or heart failure gaps), run them in parallel with current reporting, and expand only then. The safest approach is to keep workflows stable while improving the data foundation underneath, then surface population health insights inside the tools teams already use.
Which data model is best: FHIR, OMOP, or proprietary?
It depends on what you’re optimizing for. FHIR is strong for interoperability and rich clinical context. OMOP is strong for standardized research and large-scale observational queries. Proprietary models can move fast for narrow needs but often limit reuse and sharing later. Many health systems use a hybrid: FHIR for ingestion and exchange, plus an analytics-friendly layer for performance and scale.
How long does it take to consolidate data across multiple facilities?
It depends on the number of source systems, data quality, and the consistency of definitions across sites. A first “usable” consolidation for 1–2 priority programs can often be delivered in a few months, while enterprise-wide normalization across facilities and contracts is typically a longer, iterative effort. Most organizations s쳮d by delivering value early, then expanding coverage source by source.
What are the four pillars of population health management?
A practical way to think about the pillars is: population health management analytics analytics, data, care delivery workflows, and governance. Data brings together clinical, claims, and social context. Analytics turns it into cohorts, gaps, and risk signals. Care workflows convert insights into action. Governance keeps definitions consistent, access safe, and results trusted across teams and facilities.
Stay in touch
Subscribe to get insights from FHIR experts, new case studies, articles and announcements
Great!
Our team we’ll be glad to share our expertise with you via email